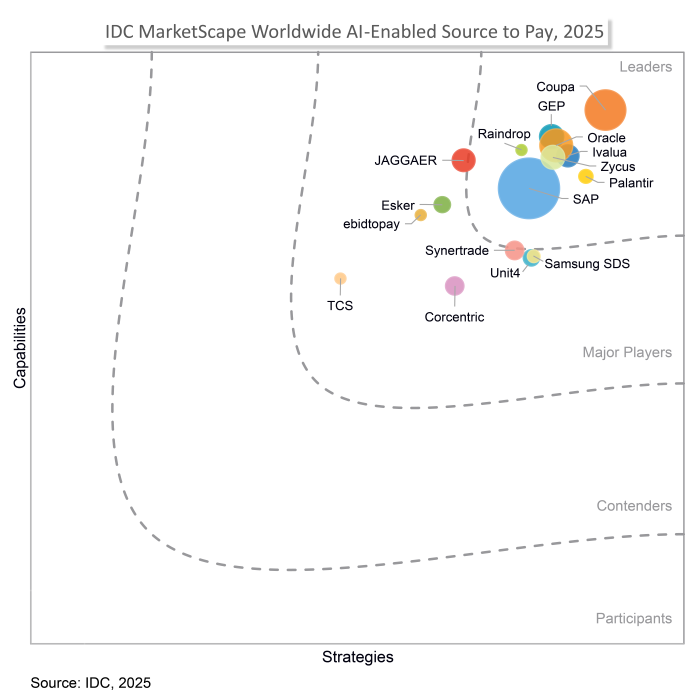
[IDC] MarketScape: Worldwide AI-Enabled Source To Pay 2025 Vendor Assessment
Reshape Source-to-Pay
IDC's 2025 Vendor Report
Samsung SDS is positioned as a Major Player
Samsung SDS is thrilled to be named a Major Player in the IDC MarketScape: Worldwide AI-Enabled Source To Pay 2025 Vendor Assessment. This assessment evaluates source-to-pay (S2P) solutions, which encompass the full range of activities involved in procuring goods and services. S2P solutions enable organizations to streamline procurement processes, reduce costs, ensure the timely delivery of goods and services, and foster robust supplier relationships. In the report, IDC MarketScape highlighted Samsung SDS’s strengths:
- Expertise in direct procurement and supplier collaboration. Samsung SDS' S2P solution is particularly strong in direct procurement, offering advanced modules for design to source, supplier collaboration, and direct materials management.
- Flexible, scalable cloud deployment. The platform supports public, private, and hybrid cloud deployments on both Samsung SDS' infrastructure and major global cloud providers, enabling organizations to meet data sovereignty, security, and scalability requirements.
- Comprehensive compliance and localization. Caidentia provides robust compliance management, including audit trails, regulatory documentation, and support for regional legal requirements

Source: “IDC MarketScape: Worldwide AI-Enabled Procure-to-Pay Application Vendor Assessment”, By Patrick Reymann, IDC #US53561525, June 2025
IDC MarketScape vendor analysis model is designed to provide an overview of the competitive fitness of ICT suppliers in a given market. The research methodology utilizes a rigorous scoring methodology based on both qualitative and quantitative criteria that results in a single graphical illustration of each vendor’s position within a given market. The Capabilities score measures vendor product, go-to-market and business execution in the short-term. The Strategy score measures alignment of vendor strategies with customer requirements in a 3-5-year timeframe. Vendor market share is represented by the size of the circles. Vendor year-over-year growth rate relative to the given market is indicated by a plus, neutral or minus next to the vendor name.